
Chicago Test Scores Duplicitious: What Do these Results Really Mean?
Was it a miracle, or just statistical manipulations?
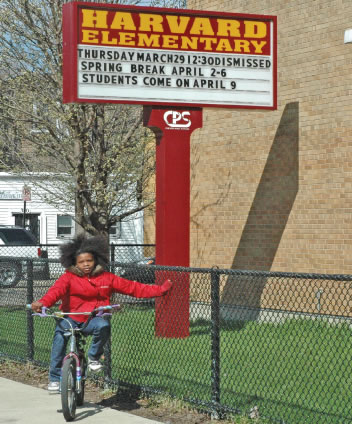 Harvard Elementary School Fourth Grade student Alexis (below) wanted to know “Why are they mad at my school?” when Harvard was visited by a Substance reporter during Spring break. Substance photo by George N. Schmidt.
For the 2005-2006 school year, Chicago reported scores on the Illinois Standards Achievement Test (ISAT) had increased in virtually every school, and the headlines once again praised the leadership of Mayor Richard M. Daley and Chicago Schools Chief Executive Officer Arne Duncan for the improvements.
But was it another miracle, or just more political manipulation of the volatile school test scores on which the fate of hundreds of politicians,thousands of teachers, and hundreds of thousands of Illinois public school children rests during an ear when high-stakes multiple choice tests supposedly provide the world with a “bottom line” with which to evaluate public schools?
The only thing that was certain when the Illinois scores were finally released early in 2007 was that they weren’t “up.”
Whether “up” meant anything positive to the people of Illinois was anything but certain, however. By the beginning of April 2007, several interesting facts had been reported about the 2006 ISAT and PSAE testing programs:
-- the scores were unusually late, due to problems with the huge private company the creates and scores them;
-- the tests may or may not have been easier than the previous year, but it was impossible to tell because citizens are not allowed to see the tests, even after they have been administered;
-- the scoring of the tests was definitely easier, as Illinois education officials admitted;
-- most of the questions about the integrity of the Illinois tests were similar to those arising in other states as the high-stakes testing and privatization program known as “No Child Left Behind” goes into its fifth year.
Despite the headlines and news reports claiming that the test scores show that school “reform” is doing very well in Illinois and even better than that in Chicago, the actual data are difficult to obtain, more difficult to evaluate over time, and impossible to verify.
After the initial claims about the radical increases in scores on the Illinois Standards Assessment Tests (ISAT and the Prairie State Achievement Examinations (PSAE) were released to the public in a barrage of newspaper reports, the first question was how to obtain the test results in information on the testing program.
Obtaining the results required access to the Internet. Neither the newspapers now the Chicago Board of Education published the actual school-by-school results, although they had in the past.
Even when the results were available, it was difficult to take a closer look at trends over time. The data on Chicago’s elementary schools (reprinted in this Substance) pare presented in isolation from everything else. Even the addresses of the schools are not included in the data charts. Nor are key data about the schools, including “mobility” rates, poverty levels, and the intensity of racial segregation included.
Despite the press reports claiming that Chicago’s test scores had gone “up” in unprecedented ways, an actual examination of the tests, the manner in which they were scored, and the skewed results across the city shows that little has changed.
Apparently, the problems with the Illinois test results for 2006 were caused by a number of factors, all of which call into question the integrity of the state’s high stakes testing program. From the beginning, problems with the tests’ publisher (Harcourt) were being reported. For two years in a row, the tests have been accompanied by “corrections” at the last minute. These have to be done at the local school during the testing process (sort of like changing a tire while the car is moving).
General problems that affect all of Illinois also included the change in the scoring (the ISAT at least was made easier to get “proficient” on) and the amount of time children had for various parts of the test (again, reported on the ISAT; unclear about the PSAE).
Another general problem for anyone trying to take a closer look at the ISAT scores was the fact that the general data published at the most accessible level left out the number of students tests (as measured against the number of students at each grade level in the school; the “N” that is so important when evaluating test results).
For decades, test security experts have known that one of the simplest methods of raising test scores with- out changing anything is to reduce the number of students tested from Year One to Year Two on any test in any school system. If the number of students tested is lowered by eliminating the students who are likely to score the lowest, then scores will go “up” even if nothing has really gone “up”. In fact, by this method a school or school system can make scores go “up” even if they actually go “down.”
How is this possible?
Consider a school that has 1,000 students in Year One. Of those students, 500 are “proficient” and 500 are not. In Year One, all of the students are tested, and all of the scores are reported. Based on that testing cycle, the school has “50 percent” of its students “at or above” what is called “proficient.”
In Year Two, the school still has the same 1,000 students, but it only tests the “top” (i.e., highest scoring) 500 of them. The “bottom” 500 are sent home, or suspended, or somehow eliminated before the testing.
If all of the students who scored “proficient” or above in Year One continue to score “proficient” or above in Year Two of the testing cycle, then suddenly the school has a score of “100 percent” (up from the “50 percent”). And all that was done was to eliminate the students likely to continue getting low scores.
The confusion across Illinois that arose when the 2006 test scores were released, finally, in 2007, raised even more questions for Chicago.
Chicago’s scores were released without any detailed accompanying data. And, as the footnotes to the charts accompanying this article indicate, there are dozens of questions about the scores that have been reported from the Chicago elementary schools. Arne Duncan avoids any detailed questions about the elementary test scores, simply repeating talking points about how they went “up” (without the quotes in Duncan’s case) and how that is the result of everyone’s hard work and the leadership of Mayor Richard M. Daley.
But can anything be known about the city’s schools from the 2006 data provided by ISBE and CPS? The most obvious thing that jumps out from the data on Chicago’s elementary schools is that the creaming effect that hits when students go to high school has a very profound impact on the high schools that also serve a cohort of seventh and eighth graders. The “elementary” data for Crane, Harlan, Taft, Morgan Park, Kenwood, and Whitney Young show that students in the seventh and eighth grade academic programs at these schools either have sharply reduced scores when they go into high school — or they are taking advantage of the academic programs for the final two years of elementary school, then going to one of the academic magnet schools for high school. Of the high schools in Chicago that also report data as “elementary” schools, only Whitney Young sustains the highest scores on both the ISAT and the PSAE. All of the others show significant (Morgan Park; Kenwood) or incredible drops from their ISAT to PSAE scores.
Aside from the confusion arising from the elementary data for elementary schools included in high schools, the charter schools are apparently allowed to choose their own methods of reporting to CPS. Chicago Inter- national Charter School (CICS) for example, seems to include all nine of its “campuses” in its one-line summary data. Others amalgamate even more curiously.
An additional problem for anyone attempting to analyze Chicago’s elementary school test data, as presented from the 2006 ISAT by ISBE and CPS, is that there is not explanation of how many elementary schools are not part of CPS, and why some were not reported.
Under “No Child Left Behind,” every school was supposed to have reported something about every child. Chicago hasn’t even made clear how many “schools” it now has, let alone how children are performing in standardized tests in those schools.
Once a reporter goes beyond the scripted quotations from CPS and Illinois officials, the data presented, finally, from the 2006 testing program raise more questions than answers. Among the questions still unanswered is where four major schools (Nancy B. Jefferson, Montefiore, Northside Learning Center, and Southside Learning Center) have been reported. As a result, the questions continue.
Article Extras: Chicago's 2006 ISAT Scores.
Download the April 2007 Substance to view a complete listing of Chicago's ISAT scores (pages 8-11).
Viewing the PDF requires Adobe Acrobat Reader or Macintosh Preview. Download a free copy of Reader here.