
DEC PRINT ARTICLE: The 19th Annual Bracey Report on The Condition of Public Education in the USA
[FIRST INTRODUCTION BY EPIC/EPRU. For 18 years, “The Bracey Report on the Condition of Public Education,” an annual review of education research and policy issues, was published by Phi Delta Kappan. In 2009, EPIC/EPRU was pleased to become its new publisher.
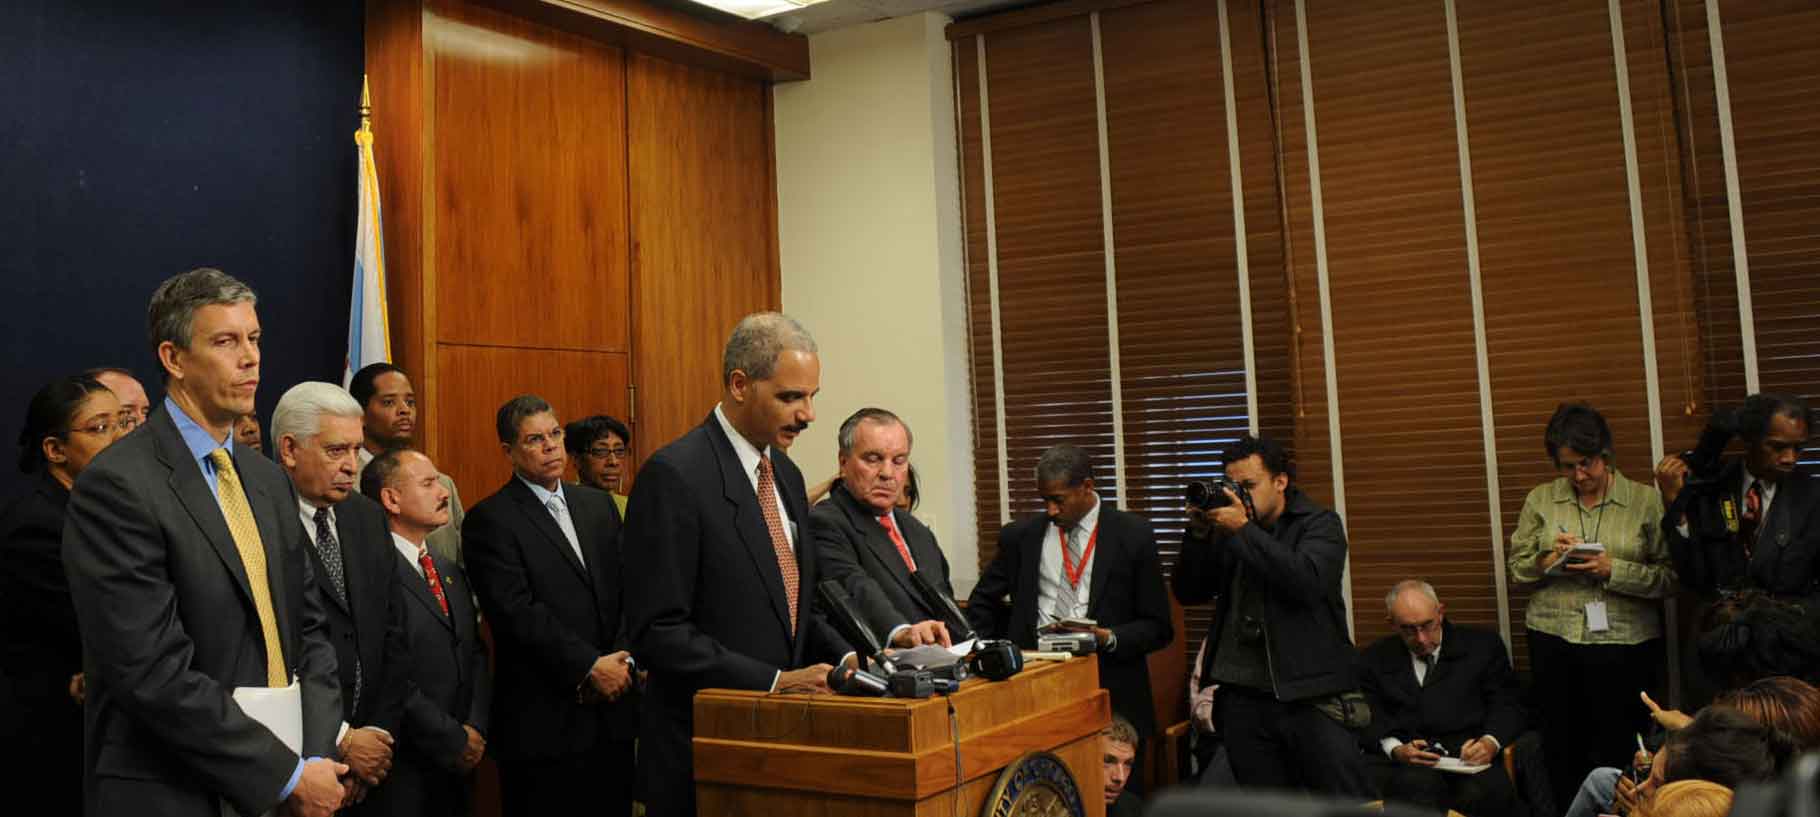 U.S. Attorney General Eric Holder (center at podium) traveled to Chicago on October 7, 2009, to do damage control for Chicago Mayor Richard M. Daley (on Holder's left) and former Chicago Schools CEO Arne Duncan (far left in photo with yellow tie). While Daley was in Copernhagen trying unsuccessfully to get the 2016 Olympics for Chicago and Duncan was putting the finishing touches on his "Race To The Top" plan as U.S. Secretary of Education, the brutal murder of Fenger High School student Derrion Albert, recorded on a camera phone as it was happening, drew public attention to Daley's versions of corporate "school reform." Critics said that Daley had failed to make any meaningful changes in Chicago's schools during the 14 years since he had gotten complete control over them (via the Amendatory Act of 1995) and that Daley's "turnaround" policies (implemented by Duncan while in Chicago) had destabilized Fenger High School and contributed to the gang problems that resulted in Albert's death. Substance photo by George N. Schmidt.Sadly, Gerald W. Bracey passed away before he finished editing what will be the final Bracey Report. We have suffered a great loss. Although he was a social scientist of considerable talent he eschewed esoteric language and instead spoke and wrote plainly. His writings left strong impressions on readers, whether expert or layperson. When he judged that an official, a newspaper, or a scholar had played lightly with the truth, his expert knowledge was directed toward withering critiques. He fearlessly exposed the errors in fact, flaws in methods and illogic that were built into all too much education research and all too many education “reforms.” Jerry had little patience for received wisdom, no matter how powerful its purveyors.
Fortunately for us all, Jerry’s last report was sufficiently enough developed that it was possible for Susan Ohanian and Pat Hinchey to finish the necessary editorial work. Jerry’s wife, Iris, helped, too, by encouraging us to publish the final Bracey Report and by providing Jerry’s notes and reference material. As a result, the Report has been completed with fidelity to Jerry’s words and intentions.
The Report is almost completely Jerry’s but, of course, any shortcomings are ours.
When Jerry passed away, we were contacted by many of the people who have been touched by Jerry and his work and were asked to create a memorial fund or project that others could donate to in his memory. We have now created one, attached to the policy centers that had been Jerry’s academic home following his 2005 departure from George Mason University. Working with the CU Foundation, we are building a memorial fund that would, if fully funded, provide a doctoral fellowship in Jerry’s name. We’re thinking of it as the Bracey Memorial Fellowship, given to a doctoral student with a research-based, hard-nosed commitment to further truth, equity, and social justice.
If we reach the $25,000 level for all donations in Jerry’s name, we can create an ongoing scholarship/fellowship. Even if we do not reach that threshold, we will still use the money for student support in Jerry’s name. Those who would like to contribute may go to http://www. colorado. edu/education /pdfs/Gerald% 20Bracey.pdf.
Our plans also include a continuation of the Bracey Report tradition by publishing an annual report in his honor. Realizing what big footsteps we will be attempting to fill, we hope our contributions will serve others as well as Jerry’s have served us. Here then is the 2009 Bracey Report on the Condition of Public Education. http:// epic policy.org /publication /Bracey- Report]/
Publishers’ Note: The Bracey Report is unique, a departure from EPIC/EPRU’s other publications. For this year’s report, we asked him to identify and discuss the research support for what he considers to be three of the most important assumptions about how to reform public education. Whether you agree or disagree with his analysis, we hope you find his views provocative and helpful as you make up your own mind about how best to go about improving America’s public schools. Alex Molnar, Kevin Welner, http://epicpolicy.org/ publication/Bracey-Report ]
The Bracey Report on the Condition of Public Education, 2009, By Gerald W. Bracey
In the previous 18 years, the basic technology of the Bracey Report was the drawer. For 12 months I put material that I thought had report potential into a drawer that, as the years went by, grew from a small desk drawer to the bottom half of a file cabinet — an unobtrusive measure of how education, for better and worse, has moved ever more to center stage in policy discussions about the nation’s social well-being. Toward June (for an annual August deadline) I would empty the drawer/file, sort the contents into categories, and write about those that seemed the most cogent. In the last few years, I have had to apologize for not
covering some issues because of space constraints. The new process begun with EPIC/EPRU for 2009 reverses the drawer-dump procedure. We decided in advance on three prominent policy-relevant assumptions. This narrows the scope of the coverage, but broadens the last-12-months focus of earlier reports, extending its temporal range. These assumptions are that:
1. High-quality schools can eliminate the achievement gap between whites and minorities.
2. Mayoral control of public schools is an improvement over the more common elected board governance systems.
3. Higher standards will improve the performance of public schools.
I take each issue in turn.
High-quality Schools
Why Choose This Issue?
Ever since the launch of Sputnik in 1957, schools have been seen as the failing institution in America. An endlessly repeated claim has been that for America to “succeed,” the nation needs more “high-quality” schools. Secretary of Education Arne Duncan contends, “We have to educate ourselves to a better economy” (1). The issue of school quality is thus at the forefront of attempts to improve society as a whole.
In his May 7, 2009 column, an essay that reverberated throughout policy circles, New York Times pundit David Brooks cast the issue this way: “Some experts, mostly surrounding the education establishment, argue that schools alone can’t produce big changes. The problems are in society, and you have to work on broader issues like economic inequality. Reformers, on the other hand, have argued that school-based approaches can produce big results.” One can certainly contend that Brook’s dichotomy (2) between the “establishment” and the “reformers” is false, but it is common today. The same can be said of his claim that “educational establishment” types argue that “the problems are in society” alone. I know no education professionals who make that argument, though I know many who argue, as I would, that we must address problems in society as well as in the schools. Still, the idea that education professionals deny that reform is necessary in some schools and prefer to shrug their shoulders and wait for social change remains a dominant, if inaccurate, perception.
What Do We Know?
We must begin with what we don’t know: there is no common definition of “high-quality school.” No Child Left Behind has various classifications for underperforming schools and sanctions for those that repeatedly fail to make Adequate Yearly Progress (AYP) on test score increases, even if only one of the required reported subgroups fails to attain that criterion. However, NCLB is silent on “adequately-performing” or “high-performing” schools, by default suggesting only that more successful schools are characterized primarily by high attendance (for enrolled students) and by some level of test performance (on disparate state tests with arbitrary cutoff scores — more on that later).
Test scores, however, are an imperfect instrument for judging the quality of a school, or, as Iris Rotberg has observed, the quality of any national education system. Nevertheless, they are the currency of the day. In testing terms, data (detailed below) indicate that increases in high-quality schools will have to come largely from low-income neighborhoods, where students with the most challenges have long been served by the most under-resourced schools. Thus, the key question becomes can schools alone overcome the difficulties associated with poverty?
Advocates who answer yes usually contend that to be high-quality, schools need only high standards, high expectations, and strong principals leading a faculty of highly qualified teachers. However, terms like “high standards” and “high expectations” are usually left undefined, as if their meanings were self-evident — which they are not. Ignoring such gaps in rationale, No Child Left Behind’s reliance on testing and sanctions codifies the conception that schools alone are capable of erasing the achievement gap and need only to be required to do so.
Similar calls for more high-quality schools, however defined, issue from multiple quarters. Many critics cite the performance of American students on international comparisons of mathematics and science. The most often used comparison comes from rankings on the Programme for International Student Assessment (PISA), from the Organization for Economic Cooperation and Development (OECD). Most recently (2006), American students ranked 24th of 30 OECD nations in mathematics and 17th of 30 in science. (3) Errors in the test booklets prevented the reporting scores for American students in reading. It should be noted that these rankings are determined by nations’ average scores. Some researchers have suggested, however, that average score comparisons are not useful: even presuming that the tests have some meaning for future accomplishment, average students are not likely to be the leaders in fields of mathematics and science. Those roles are more likely to fall to those scoring well. A publication from OECD itself observes that if one examines the number of highest-scoring students in science, the United States has 25% of all high-scoring students in the world (at least in “the world” as defined by the 58 nations taking part in the assessment — the 30 OECD nations and 28 “partner” countries). Among nations with high average scores, Japan accounted for 13% of the highest scorers, Korea 5%, Taipei 3%, Finland 1%, and Hong Kong 1%. Singapore did not participate.
The picture emerging from this highest-scorer comparison is far different than that suggested by the frequently cited national average comparisons; it is a picture that suggests many American schools are actually doing very well indeed.
Of course, the U.S. is much larger than these other countries and should be expected to produce larger numbers of successful students. But it is only when we look beyond the mean and consider the distribution of students and schools that we see the true picture. Students attending American schools run the gamut from excellent to poor. Well-resourced schools serving wealthy neighborhoods are showing excellent results. Poorly-resourced schools serving low-income communities of color do far worse. Where is it, then, that improvement is needed?
I said above that if there are to be more high-quality schools (or at least, “high-quality” schools in terms of high or rising test scores), they will have to be developed in low-income neighborhoods. Evidence for this contention comes from the 2001 Progress in International Reading Literacy Study (PIRLS). (4)
It is evidence that suggests the magnitude of the problem to be overcome.
Highest scoring nation: Sweden 561 (Finland did not participate)
U. S. average: 542; International Average: 500; Number of countries: 27
Several points from these data should be noted. First, the schools with, say, fewer than 10% of the students in poverty are not necessarily the nation’s wealthiest schools, although some, no doubt, are. The other 90% of students could be from white collar homes, blue collar homes, or some mix. From this statistic alone, we cannot tell. Second, the top two categories, which contain about 34% of all students, outscored the highest nation.
Third, although it cannot be seen from these few figures, if the schools with poverty levels of 25 - 50% constituted a nation, their average score of 551 would rank them 4th among the 27 participating countries.
In fact, then, the majority of American students did very well on this measure: the only American schools with scores well below the national average were those whose student population was composed almost entirely of students from poor homes.
The strong relationship between poverty and test scores seen in the PIRLS data are replicated in the Scholastic Achievement Test (SAT), in the Trends in International Math and Science Study (TIMSS), and in the National Assessment of Educational Progress (NAEP). (The relationship cannot be shown in the OECD’s PISA discussed earlier because it tests 15-year-olds, and there is no good direct or proxy measure for high-school students’ poverty levels.) Before taking up the question of whether schools alone can remedy the achievement gap for poor children, we have to ask what is known about the effect of poverty on children. What are some of the out-of-school factors that contribute to poor children’s lower performance?
First, there is consensus among pediatricians that children in poverty live under more stress than those in more affluent, and hence secure, environments. This stress can have life-long damaging impact: Neural circuits for dealing with stress are particularly malleable (or “plastic”) during the fetal and early childhood periods. Early experiences shape how readily they are activated and how well they can be contained and turned off. Toxic stress during this early period can affect developing brain circuits and hormonal systems in a way that leads to poorly controlled stress-response systems that will be overly-active and show to shut down when faced with threats throughout the lifespan. (5)
Although this report doesn’t discuss implications of early stress for classroom learning and behavior problems, it does link prolonged childhood stress to depression, anxiety disorders, alcoholism, drug abuse, cardiovascular disease, diabetes and stroke. It is impossible to think that the precursors of such an array of unhappy adult outcomes would not be visible in the classroom.
The National Research Council’s Institute of Medicine reached similar conclusions: The inextricable transaction between biology and experience also contributes to a better understanding of developmental disorders and the effect of early intervention. Hereditary vulnerabilities establish probabilistic, not deterministic, developmental pathways that evolve in concert with the experiential stressors, or buffers, in the family, the neighborhood, and the school. That is why early experiences of abuse, neglect, poverty, and family violence are of such concern. They are likely to enlist the genetic vulnerabilities of some children into a downward spiral of progressive dysfunction.
By contrast, when children grow up in more supportive contexts, the hereditary vulnerabilities that some children experience may never be manifested in problematic behavior. Understanding the co-action of nature and nurture contributes to early prevention. (6)
Poor children get off to a bad start. Their mothers are less likely to obtain adequate prenatal care and they are more likely to be Low Birth Weight (LBW) babies. LBW and, especially, Very-LBW children have cognitive and emotional
difficulties later on. Black Americans are almost twice as likely as whites to have LBW babies and 270% more likely to have VLBW children (7).
As for other prenatal influences, David Berliner of Arizona State University notes, “If alcohol, tobacco, and cocaine use are higher in poor neighborhoods, as is often found, then the schools in those neighborhoods also will have more children whose intrauterine environment was compromised.” (8) These drugs reduce head circumference, reduce cortical gray matter and reduce total brain volume as measured by MRIs taken at school age. The effects of the three drugs are thought to act cumulatively. Even worse for later behavioral outcomes is prenatal ingestion of amphetamine or methamphetamine.
Other issues abound. For example, a scandal erupted in Prince George’s County, Maryland in early 2007 when a 12-year-old died from an infected tooth. A simple timely extraction would have saved the child, but the mother was uninsured and could not find a dentist to pull the tooth. Eventually, the infection spread to his brain, killing him. This for-want-of-a-dentist case — occurring next door to the houses of Congress in the most prodigal nation in the world — is an example of the more general problem of health care: Poor kids don’t get much of it. We can imagine the misery of this boy and certainly should consider how much he was able to pay attention in class during the months of his ordeal. And when his 10-year-old brother with a swollen jaw complained of a tooth ache, it
again took months to find an oral surgeon, who found he had six abscessed teeth. (9)
There is no press report on how he was doing in school during these months. According to the U.S. General Accounting Office, untreated cavities are nearly three times as prevalent among poor children as among middle-class children. (10)
Children with a mouthful of aching teeth can’t concentrate; children who can’t see will have reading difficulties; children who can’t hear what the teacher is saying will likely look like they aren’t paying attention. In addition, poor children are made more susceptible to illness by the absence of nutritious food, or even of food itself. In comparison to national averages, Berliner observes, food insecurity occurs 3.4 times as often in households below the official poverty line, 2.7 times as often in household headed by single women and twice as often among black and Latino households. The food insecurity problem is particularly pernicious because the energy generated by food goes first to critical organs. If there is any left over, it is allocated for growth. The last priorities for food-generated energy are social activity and learning.
It is not only food insecurity but also food quality that affects poor children. According to Linda Perlstein, who observed children for a year in a poor school, “Many children in poverty are given bottles of sugar water or Oodles of Noodles broth as infants, Froot Loops as toddlers, and by the time they show up at school they’re often overweight, undernourished and plagued with rotting teeth.” (11) Perlstein saw many arriving at school at 7:45 clutching sodas from McDonald’s and they laughed when she asked them if they had to drink milk at home. Poor children are also more likely to ingest quantities of pollutants. Coal – fired power plants and municipal waste incinerators are the two major sources of mercury in this country, and both are much more likely to be found in or near poor neighborhoods. Mercury is known to produce brain and nerve damage in fetuses and young children.
A more common contaminant is lead. The most thorough examination of lead has been conducted by Michael Martin of the Arizona School Boards Association, whose 2002 monograph is titled “A Strange Ignorance.” (12) The ignorance is strange, says Martin, because there is so much evidence about the ill effects of lead poisoning uncovered by pediatricians, doctors, anthropologists, criminologists and many other professions. Yet politicians and educators ignore the evidence and continue to march under the misbegotten banner that “all children can learn.” Martin presents mountains of evidence linking lead poisoning to an inability to learn, to attention deficit disorders, to violence and to drug use. He also reports that the cover story of the July 15, 1991, issue of Newsweek was about the many pernicious effects of lead poisoning in children. And still such poisoning continues. As in many areas, policy decisions have favored industry and economic concerns over children’s health.
Discussing family relations and stress, Berliner observes that “Children from families that suffer from violence, from whatever income group and race, often display social and emotional problems that manifest themselves in the schools they attend. Too often these children show higher rates of aggressive behavior, depression, anxiety, decreased social competence and diminished academic performance. Children exposed to violence were found to suffer symptoms that resemble post-traumatic distress disorder.” (13) Earlier he had described how these dysfunctional symptoms also have negative effects on the children’s classroom peers. Violence is most often visited upon poor children. Even summer poses a challenge to poor children. In a 2007 large longitudinal study, (14) sociologist Karl Alexander and colleagues found poor children progressing well during the school year (at least as indicated by standardized tests), but losing much of their gain over the summer. In contrast, middle class and affluent children did not show such “summer loss.” That might be, Alexander reasoned, because middle class children spend their summers going to libraries, to science and art museums, and to fairs; they also often travel with their families.
Even organized sports teach children about mathematics, rules, teamwork, planning, and so on. Likewise, a family game like Scrabble is about linguistics, psychology, mathematics, memory, competition, and doggedness. It’s about mastering the rules. (15) In short, middle class children experience many growth opportunities not available to most poor children. Alexander felt such advantages accounted for the fact that middle class and affluent children do not display the summer loss so often noted in poor children.
I offer here only a sketch of the large array of physical, medical, social and psychological disadvantages that poor children encounter in their environments. I could have described more. Readers are referred to Berliner’s monograph and to the “Poverty is Poison” chapter in Education Hell: Rhetoric vs. Reality. (16) These disadvantages all operate to attenuate achievement in schools. The question is, can “high-quality” schools alone offset them?
How Promising Is This Reform?
In relation to that question, the influential Brooks’ piece mentioned above is worth a much closer look. Brooks touts what he calls the “Harlem Miracle,” the fact that in 2008, the eighth-graders in Harlem Promise Academy outscored the New York City average for white students. As Brooks put it, “In math, Promise Academy eliminated the achievement gap between its black students and the city average for white students.” (17) He points to this outcome as an example that highquality schools — or what he terms “no excuses” schools —can alone transform student outcomes. This argument, however, is based on a single statistic in a single study by Harvard economists Will Dobbie and Roland Fryer titled “Are High- Quality Schools Enough to Close the Achievement Gap?” (18)
A closer look at this highly publicized data point shows that it was true only for one year, one grade, and one subject. For other grades, the students remained substantially below white students, and for all three years of the comparison, the gaps between whites and blacks on the English-Language Arts tests were quite large. In addition, Columbia University sociologist Aaron Pallas has observed that these students also took the Iowa Tests of Basic Skills, where they scored only at the 33rd percentile despite their strong performance on state tests. “Scoring at the 33rd percentile,” deadpanned Pallas, “is not a great success story.” Pallas titled his blog on the topic “Just how gullible is David Brooks?” (19)
Even Dobbie and Fryer, whose 2009 work underpins the Brooks piece, describe the Promise Academy schools in terms that make them seem unique, atypical of images conjured by the phrase “high-quality school.”
First, they estimate that Promise Academy students who are below grade-level spend twice as much time in class as the typical New York City public school student, while those at or above grade-level spend 50% more. Dobbie and Fryer further note: “The schools provide free medical, dental and mental-health services (students screened upon entry and receive regular check-ups), high-quality-nutritious cafeteria meals, support for parents in the form of food baskets, meals, bus fare and so forth…the school also makes a concerted effort to change the culture of achievement, surrounding students with the importance of hard work in achieving success.” (20) Such attention to student health and other non-academic interventions is neither cited by Brooks as possible contributing factors nor typical in the high expectations/ high standards formula for “high-achieving” schools. Brooks portrays Promise Academy as an exemplar, a clear demonstration that schools alone can reduce the pernicious effects of impoverished neighborhoods described by pediatricians, Berliner, Alexander, Martin, the Broader Bolder Approach coalition, and others.
However, Promise Academy schools are instead schools that consciously target the effects of “economic inequality” that Brooks dismisses. And even as Promise Academy invests resources into such things as medical care and nutritious meals, the test scores aren’t yet what Brooks appears to think they are. For “high-quality schools” to be a promising reform, even narrowly defined by test scores, conditions outside the schoolroom must be recognized and addressed. The Harlem Promise Academy actually emerges not as an example of what single-minded focus on test scores can accomplish, but as a poster child for the Broader Bolder Approach to Education coalition, which argues that school improvement must be accompanied by attention to social inequalities.
Of course, there are ways of defining “high-quality schools” independent of test scores. The University of Seattle’s David Marshak has (21) wondered why President Obama is not trying to reform schools to make all schools more like Sidwell Friends School, which the President’s daughters attend. Many would find Sidwell’s approach “high-quality,” but test scores are not mentioned in its statements of philosophy or expectations. Sidwell emphasizes “greeting the day with enthusiasm,” “a search for truth,” and “sensitivity to the human condition.” The President has not answered Marshak. He should.
Mayoral Control of Public Schools
Why Choose This Issue?
In 1897, Mark Twain wrote “In the first place God made idiots. That was for practice. Then He made school boards.”
A 2008 article in The Atlantic was titled, “First, Kill All the School Boards.” Thus, the governance of public schools through local school boards has long been controversial and continues to be.
In the post-World War I decades, Progressives attempted to improve school boards as representatives of their communities by making the elections non-partisan and scheduling them separately from regular political elections.
Some now criticize this approach as making the elections safe for union-backed candidates: few people vote in off-season elections, allowing unions to win by mobilizing only the few people needed to support particular candidates.
Currently, an increasingly popular alternative is to have mayors run the schools, at least in large urban systems. Advocates for mayoral control contend that these systems are too large and unwieldy to be effectively managed by boards whose composition changes, whose existence blurs lines of authority, and whose members are not truly accountable to anyone. Billionaire foundation head Eli Broad told a 2009 Manhattan gathering, (22) “We don’t know anything about how to teach or reading curriculum or any of that. But what we do know about is management and governance.” And that’s why, he told the audience, “I’m a big believer in mayoral control.”
The most visible systems under mayoral control are those in Chicago and New York. Chicago Mayor Richard Daley’s schools CEO, Arne Duncan, is now Secretary of Education. In his new role, Duncan has been barnstorming the nation urging mayors to take control of schools. Disingenuously, at the 2009 convention of the National School Boards Association (NSBA), he downplayed his efforts, since mayoral control diminishes the power of boards or eliminates them altogether. He said only, “I’ve been challenging mayors to think about stepping up and doing more to help every child get a quality education.” A week earlier, however, at the U. S. Conference of Mayors National Forum on Education, he said, “At the end of my tenure, if only seven mayors are in control, I think I will have failed.” Seven is the number of city school districts currently run by mayors.
Duncan argues that strong leadership and stability are needed for urban school success. It is true that urban school superintendents reporting to school boards turn over rapidly. At the NSBA conference, Duncan observed that San Diego (where the convention was held) has had five superintendents in five years. (In addition, the superintendent at that time has now left for Houston). At the Mayors’ forum in Washington, DC, he pointed out that Baltimore had had seven different heads in 10 years. In contrast, the superintendent or chancellor or CEO or whatever the head of the schools is called, would, in the absence of a falling out with the mayor, presumably hold office as long as the mayor — at least four years, perhaps eight, and perhaps even longer in places without mayoral term limits.
Thus, mayoral control of urban schools systems is likely to be a major policy issue as long as Duncan is Secretary of Education, Richard Daley is Mayor of Chicago, and Michael Bloomberg is Mayor of New York.
What Do We Know? Chicago
Chicago’s Daley has run the schools for 13 years, with Duncan as CEO for the last seven. Mayor Bloomberg and his Chancellor, Joel Klein, have had the reins of the New York schools for seven years, since 2002; recently, the New York legislature agreed to let Bloomberg run for a third term in 2009, and it authorized mayoral control of schools through at least 2015.
Is there evidence that over these seven-year periods the schools have improved?
Test scores comprise the most readily accessible, if limited, evidence. Scores on New York’s two state tests suggest there has been improvement, but results from the National Assessment of Educational Progress (NAEP) suggest just the opposite. There are reasons to believe the state test results do not report accurate outcomes.
Duncan’s principal modus operandi has been the “turn around.” As he explained his strategy to the National Press Club on May 29, “[What] we did in Chicago was we moved the adults out. We kept the children, and brought in new teams of adults — same children, same families, same socioeconomic challenges, same neighborhoods, same buildings, different set of expectations, different set of beliefs. And what we saw was dramatic changes.” (23)
Very little of this statement is true. Yes, the adults were removed, including custodial, security, clerical and cafeteria staffs. But the children did not remain the same. For example, one school Duncan has held up as a model is the Sherman School of Excellence, an elementary school. But data indicate that during Duncan’s strategizing, enrollment dropped, mobility increased, and the percentage of low-income students at Sherman declined substantially. Not surprisingly, with the influx of more affluent students, the percentage of students who met or exceeded standards on the state test rose — from 30.5% to 40.3% in reading, over two years. Especially in light of the changing population, these modest results hardly seem to justify this reform as a “national model.” Oddly, in fact, the current percentage of Sherman students who meet or exceed standards is smaller than at some other schools currently slated for similar “turnaround.” Moreover, on the state science test, Sherman scores actually fell after the reform.
Another major Daley/Duncan effort is called Renaissance 2010. At a Commercial Club of Chicago event in 2004, Mayor Daley introduced Renaissance 2010 as a plan to close 60 schools and open 100 new ones which would be small schools, charter schools, or contract schools.
According to an article in Rethinking Schools, (24) “Renaissance 2010 has been traumatic, largely ineffective, and destabilizing” to the communities affected. When children leave their neighborhoods, as they do under this new organization, they sometimes have to cross gang boundaries to attend their new schools, resulting in spikes in violence. And when a school goes through turnaround, it loses the social fabric an experienced and professional staff provides.
As the nation witnessed the horrific stomping/beating death of a Christian Fenger High School student Derrion Albert on You Tube, they saw a “turnaround” become the deadliest school reform of all. Writing in the Chicago Sun-Times, high school teacher Deborah Lynch pointed out (25) that “reform” at Fenger meant “dumping all the staff, even the engineers,” thereby removing human capital from the school: We have relationships with kids who may not even have another adult in their homes, or their lives. It’s called human capital. We know brothers and sisters. . . We ask them how their sick mother is or how their job search is going. . . . We give them bus money when they have forgotten theirs. We share our lunches with those who missed breakfast. We kid them, we laugh with them, we exhort them to do better, to get to school on time, to work hard. . . . Oh yes, and we teach them. Yet you have to have a relationship with these kids in order to teach them. The school website indicates that along with extensive building renovations, “a highly talented faculty and staff were hired,” — which means that when Derrion Albert was killed, no one in this turnaround school had known the kids for more than three weeks.
The results of Renaissance 2010 have not sat well with the very organization to which Mayor Daley announced it, the Commercial Club of Chicago, a powerful 132-year-old corporate institution. In a June, 2009 report, (26) the Civic Committee of the Commercial Club claimed that the gains are largely the result of lowered standards: [M]ost of the improvement in Chicago’s elementary school scores over the past decade appears not to be due to real improvement in student performance. It appears to be due to changes in the tests, most notably those made in 2006 when a new testing company was brought in and a new State test was implemented, with new formats and test substance, and lower cut scores (most notably in 8th grade math) along with new testing procedures.
On July 11, 2006, Mayor Daley pointed to the surging test scores and said “With these results, it’s clear we are on our way to becoming the best urban school district in the nation.” (27). This prompted the editorial writers at the Chicago Tribune, to declare (28) that “They must be teaching some new kind of fuzzy math at Chicago Public Schools” and to point out that the state board had lowered the passing score for eighth-grade math from the 67th percentile to the 38th.
The National Assessment of Educational Progress (NAEP), less subject to “test prep” or other manipulations, has conducted “trial” assessments in 11 large urban districts, Chicago among them. The results (29) do not bear out the mayor’s joyous pronouncement. In 2003, Chicago eighth-grade math scores for white students showed 25% of them at or above the proficient level, a percentage that rose only to 35% in 2007. Moreover, Chicago’s schools are not predominantly white, but overwhelmingly black and Latino. As a Harvard Civil Rights Project report indicated, (30) Chicago’s public schools are “only a few percentage points from an experience of total apartheid for black students.”
The vaunted improvements in test scores do not appear for Chicago’s black and Latino students. In 2003, only 4% of black eighth-graders were proficient or better in math; that figure rose to only 6% in 2007. Of the remaining nine cities in the NAEP trials, only Cleveland and the District of Columbia, both under mayoral control, showed less growth for black eighth-graders. For Latino eighth graders in Chicago, the 8% proficient or better in math in 2003 rose to 12% in 2007. Among the other nine cities studied, only Charlotte and New York showed less growth. Moreover, gaps in achievement between black and white students and between Latino and white students were large (25% of white eighth-graders scored at or above proficient, with 4% of black and 8% of Latino eighth-graders at those levels), and they grew between 2003 and 2007 for grades 4 and 8.
Another potential indicator of success or failure, teacher stability in schools, shows no indication of success, either. Teacher stability has decreased, especially in low-income schools and predominantly black schools. Black, white and Latino teachers have all been moving out of those schools at increasing rates.
To some, Chicago’s Renaissance looks more like a return to the Dark Ages. What about New York?
New York’s Chancellor, Joel Klein, also arrived in 2002; Mayor Bloomberg’s supervision of the schools could extend to 2015. Before a recent New York Senate vote, the Assembly had passed a bill extending the mayor’s control from 2009 to 2015, but the Senate proved more troublesome. In spite of Bloomberg’s earlier warning that if his reign weren’t extended he thought “there’d be riots in the streets,” (31) the Senate, deadlocked and in a state of utter chaos, refused to reauthorize mayoral control before a recess. Bloomberg said he would ask the governor to call for a special session; on a radio show, he called for the State Police to “drag” senators to the Capitol for a vote. In response, a Harlem senator accused the mayor of “treating us like we’re some people on his plantation.” Despite this uproar, when the Senate reconvened, it voted 47-8 to extend mayoral control through 2015. As in Chicago, improvements in New York state test scores were trumpeted to indicate that “[M]ayoral control had produced revolutionary improvements” and “Our reforms are working. Our schools are heading in the right direction.” (32) In 2009, 82 % of students in grades 3 through 8 passed the mathematics test, compared to 74% the previous year and 57% three years earlier. However, according to the New York Daily News, these gains were illusory. Columbia University sociologist Jennifer Jennings found that “Only a fraction of the simple arithmetic, algebra and statistics that kids should learn every year has been tested…Nearly identical questions have even appeared each year…Only 54.7% of the specific math skills that the state requires seventh graders to learn were ever tested in the four years the exam has been given.” (33) Jennings found that, over time, the tests increasingly focused on skills that should have been learned in the previous grade. The New York Times reported (34) that the passing scores on the state tests had been lowered statewide and that attaining a minimal passing score for New York City could be obtained by random guessing.
Jennings and Aaron Pallas, also at Columbia, found Bloomberg’s claim that the ethnic achievement gaps are closing to be false. (35)
“[W]e have demonstrated that racial achievement gaps in New York City have remained stubbornly persistent between 2003 and 2008. Contrary to the frequent claims of Mayor Bloomberg and Chancellor Klein that they have substantially reduced the achievement gap, we show that these gaps are largely unchanged or, in many cases, growing.”
NAEP results from New York also tell a story similar to that in Chicago. For fourth-grade reading, from 2003 to 2007, the percentage of white students proficient or above went from 35% to 45%; for black students, from 9% to 15%; for Latinos, from 15% to 16%; and for Asians, from 39% to 43%. At the eighth grade level in reading, the percentage of whites proficient or above went from 42% to 41%; for blacks, from 13% to 11%; for Latinos, from 17% to 13%; and for Asians, from 35% to 37%. Thus, none of the groups showed evidence of substantial growth, with the possible exception of white fourth-graders. Particularly at the eighth-grade level, some showed decline.
In mathematics, at the fourth-grade level the percentage proficient or better did rise for all ethnic groups, but these increases were paralleled in the nation as a whole and by the other cities participating in the NAEP urban trials. At the eighth-grade level, stagnation is evident for all groups except Asians. In 2003, 38% of Asians scored proficient or better, while in 2007, 53% did.
To what Bloomberg efforts can such dismal results be attributed? The mayor took control of the schools in June 2002 and named Joel Klein, a lawyer, as Chancellor at the end of July. Reading the 171 pages of The Schools Under Bloomberg and Klein, (36) one senses that the schools have become the mayor’s private fiefdom and that his focus has centered ever more on reading and math. Money was cut from an arts program even as the central administration grew from 1,729 in 2002 to 2,442 in 2007. The city comptroller (37) called Klein’s money manipulations a “shell game” and observed that a net of 2,000 teachers had disappeared from classrooms.
When Bloomberg took over, the board of education was replaced with the Panel for Educational Policy, an attempt to establish a “balance of authority” between Bloomberg and the rest of the system. However, it quickly became known as the Panel of Educational Puppets. The panelists, “an investment banker, a lingerie store owner and an expert on electromagnetics among them — rarely engage in discussions with those who rise to address them. They do not debate the educational issues of the day, but spend most sessions applauding packaged presentations by staff. Some have barely uttered a public word during their tenures.” (38)
And, if they do utter any words, they’d better be in support of the mayor’s programs. The original panel opposed the mayor’s plan to retain third-graders who did not pass the two state tests. As time drew near for a vote on the policy, Bloomberg fired two panel members and replaced them with two people who owed their jobs to him. A Bloomberg ally, the Staten Island Borough President, replaced his panel member hours before the vote. “Never again did any of the mayoral appointees to the Panel challenge his position on an issue. This incident is remembered as the ‘The Monday Night Massacre,’ and it heralded the mayor’s conclusive suppression of the Panel’s legislative powers.” (39)
Bloomberg was unapologetic. “Mayoral control means mayoral control, thank you very much. They are my representatives, and they are going to vote for things I believe in.” (40).
Mayoral control, Bloomberg style, also means control of information. Sullivan reports that during his tenure on the panel, before a Monday vote on whether to extend grade retention to fifth grade, he repeatedly asked for results of a RAND study that had been commissioned two years prior. He received it, all 479 pages, on the Saturday before the vote. The rest of the Panel gained access at 8 p.m. Sunday.
Bloomberg has argued that under his watch graduation rates have improved. But the continued practice of “discharging” students out of schools calls that into question. According to the New York Times, (41) discharges “are the black hole of the system’s record keeping. School administrators are required to explain each student’s departure by assigning one of more than three dozen codes, indicating, for example, that the student moved out of the city, enrolled in a vocational program, got a full-time job, moved into a high school equivalency programs or was expelled after a long-term suspension.” Most appear to end up in GED programs, but few appear to obtain that certificate.
The New York Times reporters use the term introduced by Steve Orel, when he opened the World of Opportunity in Birmingham, Alabama, to rescue students “officially terminated” by the city school system: Pushout. (42). If discharge rates increase, so do graduation rates, because discharges are not counted as dropouts. No doubt not all discharges are dropouts, but Jennings and Haimson note if they were counted as such, the city’s officially reported graduation rate of 62% in 2007 would fall to 46%. It would fall further to 44% if GED completers were not counted as graduates.
The graduation rate is also inflated to some extent — no one knows how much — by the technique of “credit recovery.” Students who fail a course can get credit by activities — apparently with nothing like the rigor of attending class — other than retaking the course or going to summer school. Most often, they sit in front of a computer and complete electronic workbook assignments.
How Promising Is This Reform?
A close look at the two most visible exemplars of mayoral control, Chicago and New York, yields results that counter the image created by those in control.
“Reforms” that are supposed to help children do better are primarily used to make the adults who control the schools look good. Performance on tests that are subject to manipulation show improvement. Performance on tests that are free of manipulation show no improvement and no closing of ethnic achievement gaps. In reading the literature about the mayoral systems, one repeatedly encounters words like bully, authoritarian, autocratic, arbitrary, intrusive, despotic, dictatorial, disenfranchisement, rubber stamp, exclusion (of parents) even “Brezhnev-era Soviet Union.” (43). To be sure, these words appear in articles critical of the system, but the articles appearing in the New York media, especially the New York Times, appear to be highly skeptical of the information received from the Mayor, Chancellor and their public relations offices (even as the number of teachers declined, the New York City schools public relations office grew from three people in 2003 to 12 currently).
According to Stanford University’s Michael Kirst, (44) “These mayors fancy themselves as better-trained public administrators. They have the hubris, or the guts, to take this on.”
“Hubris” is a Greek word meaning overweening pride and in Greek literature, those who displayed hubris were eventually struck down by the gods. But so far, money fuels hubris. Now, Arne Duncan aides, abets — and requires this version of reform with the lure of big government grants. In Diane Ravitch’s words, (45) “Obama Gives Bush a 3rd Term in Education.”
Kirst’s comments lead to another concern about mayoral control: mayors don’t last forever. The current crop of mayors running the schools wanted control. Their successors might not evince such motivation. At the moment, both cities are in the hands of people holding the position l’etat c’est moi. That is not a condition that will likely last forever, but the end definitely is not in sight. Theoretically, of course, mayoral control need not look like those discussed here, but it is disturbing that the two most visible models appear to be simultaneously undemocratic and ineffectual. Benjamin Barber once referred to public schools as “workshops of our democracy.” (46) It does not seem that they are furthering democratic goals in New York and Chicago — nor improving achievement.
High Standards
Why Choose This Issue?
Excelsior! has been the motto of many educational reformers in this nation for over a century. In 1892, when James Mayer Rice was working for Walter Hines Page, editor of a brainy and provocative magazine about social issues titled The Forum, he visited schools in 36 cities and wrote a sizzling series of exposé articles for the magazine.
According to historian Lawrence Cremin, Rice found similar terrible situations everywhere: “With alarming frequency, the story was the same: political hacks hiring untrained teachers who blindly led their charges in singsong drill, rote repetition, and meaningless verbiage” (47) The call for higher standards appeared in many reform documents in the first half of the 20th century, but became a public cry largely after the launch of Sputnik in 1957, and especially after “A Nation At Risk” in 1983. On March 24, 1958, the editors of Life magazine launched a five-part post-Sputnik series, “Crisis in Education,” with this damning assessment: “Most appalling, the standards of education are shockingly low.” (48) That same year, U. S. News & World Report brought in Arthur Bestor, (49) author of Educational Wastelands: The Retreat from Learning in Our Public Schools, to explain how a technologically backward nation like Russia could beat us into space. Bestor put the blame on the low standards of the Life Adjustment Education programs. To blame the high schools of the late 1950’s for failures of people who had graduated 20 or 30 years earlier was patently absurd, but it happened anyway. (In fact, on September 20, 1956, over a year prior to Sputnik, the U. S. had a four-stage rocket in the air. After the first three stages had fired, the rocket was 862 miles in the air and traveling at 13,000 miles an hour. The fourth stage could have easily slipped a satellite into orbit — but the fourth stage was filled with sand. For political, military, and diplomatic reasons, the Eisenhower administration had decided not to orbit anything.
Technology and the schools had nothing to do with it. Eisenhower was actually pleased when the Russians went first and was quite perplexed over why anyone would blame the schools.) No matter the realities: the quest for high standards continued. The 1977 report (50) from a College Board panel examining the decline in SAT scores attributed most of the shift to changes in the composition of the test takers and to what it called a “decade of distraction.”
However, it also pointed to a turn away from high standards. In a 1982 examination of NAEP results, Wirtz and Lapointe wrote, (51) “The strongly sensed deterioration in education seemed confirmation of the failures of both of these services (government and the professions). So it was decided not to rely this time on either of these agencies. Instead, the decision in one State and community after another was to move directly on the schools, not with funds but with “standards.” This report set the stage for another that appeared the following year. “A Nation at Risk,” (52) often called “the paper Sputnik,” lamented “we tend to express our educational standards and expectations largely in terms of ‘minimum requirements.’” Focus on excellence, said the report; raise standards.
The first “education summit” in 1989 produced national goals and jumpstarted a movement whereby the professional education subject-matter organizations would produce voluntary national standards in each field. What this movement revealed were wide fissures within educational disciplines about what should be taught and how. For example, when D.C. functionaries discovered what the Standards Project for the English Language Arts (SPELA), co-directed by the International Reading Association, the National Council of Teachers of English, and the Center for Reading at the University of Illinois, was producing as standards, they dropped funding for the project. On January 20, 1995, the Senate voted 99-1 on a resolution “To prevent the adoption of certain national history standards.” (53). Part of the resolution declared “If the Department of Education, the National Endowment for the Humanities, or any other Federal agency provides funds for the development of the standards. . . the recipient of such funds should have a decent respect for the contributions of western civilization, and United States history, ideas, and institutions, to the increase of freedom and prosperity around the world.”
Editorial writers in the New York Times disagreed, (54) declaring, “Reading the standards and support materials is exhilarating. Students will rejoice in learning from them; teachers will cherish using them.”
Bennett Johnston, the only Senator voting against the resolution, did so because he thought it didn’t go far enough in condemning the standards. Far from being an esoteric argument among academics, the core question was the breadth and depth of what should be taught to America’s youth. There is no reason to believe that these splits have narrowed in the ensuing 20 years. Yet, the Obama administration is bypassing the public debate by essentially privatizing the writing of Common Core standards.
The idea that standards, in and of themselves, can effect major improvements in education has been repeated often over the years. In 1993, Robert Spillane, then the superintendent of Fairfax County (VA) public schools, talked of the lack of standards as education’s “dirty little secret…” (55). Spillane complained that “the abilities of the frontline workforce in many competitor countries are substantially higher than they are in the United States”; he claimed that “these countries are educating everybody to higher levels than we are, and that one of the main differences between us and them is standards: They have them and we don’t.” This
commonly made cause-and-effect argument is far from being an established truth.
As is evident from tracing such historical judgments, American educators have, from almost the outset, been obsessed with standards. Historian Lawrence Cremin captured this obsession well when he wrote, “Just about the time Adam first whispered to Eve that they were living through an age of transition, the Serpent doubtless issued the first complaint that academic standards were beginning to decline.” (56).
And so it goes.
What Do We Know?
On March 10, 2009, President Obama’s speech to the United States Hispanic Chamber of Commerce contained a statement that neither members of the Chamber nor any but a very few people in the U. S. Department of Education understood: “Today’s system of 50 different sets of benchmarks for academic success means fourth-grade readers in Mississippi are scoring nearly 70 points lower than students in Wyoming — and they’re getting the same grade. Eight of our states are setting their standards so low that their students may end up on a par with roughly the bottom 40 percent of the world.”
Where did this gap in test scores appear, and from whom or what were the states getting “the same grade” for such disparate performance?
The President did not identify the source of his statistics, but because Wyoming and Mississippi only share one test in common, the National Assessment of Educational Progress (NAEP), the statistics could only have come from NAEP. However: a quick check of NAEP results showed that Wyoming’s fourth graders scored 223 while Mississippi’s came in at 204. That’s 19 points — a significant difference, but not the 70 points the president mentioned. Eventually, I traced the President’s information to an obscure 2007 National Center on Education Statistics report (NCES) on NAEP scores (57) which comes with the advice “these results should be used cautiously.” One would have hoped that those feeding statistics to the President would have heeded this advice.
I would not call a nationally reported speech cautious use. This NCES monograph attempts to determine what level on the NAEP scores equates to the state test score that qualifies a student as “proficient.” Mapping state-level proficient scores onto the resulting NAEP scale, the study finds that the equivalent NAEP score for “proficient” fourth-grade readers in Mississippi is, indeed, 70 NAEP scale points lower than the “proficient” rating for fourth grade readers in Wyoming — the source of the President’s claim that states with wildly varying performance get the same “grade” (“proficient”).
As determined by such mapping, most states have a proficiency standard for fourth-grade reading that puts them in the “Below Basic” category for NAEP (although two do have a margin of error that extends into the Basic category). Only seven states have a proficiency standard that correlates even with the NAEP Basic category; none has a cutoff that aligns with NAEP’s Proficient category. Several observations about data from this study are worth noting.
First, the most dramatic figures in terms of states falling Below Basic are those on fourth grade reading results. At the eighth grade, most states’ reading scores fall into the Basic range, as they do in mathematics for both grades 4 and 8.58 When all results are considered, it becomes evident that the President’s handlers also gave him only the most dramatic Mississippi - Wyoming difference. For reading at the eighth grade, the difference is about 30 points. Moreover, the accuracy of the equivalency scale NAEP developed is open to some question. Raw scores on the NAEP assessment itself don’t align well with the equivalency scale.
All of this, to me, points to a conclusion that there is little reason to refer to the NAEP equivalents except to show that states vary great in the “rigor” of their standards. If some states with low standards score high and some states with high standards score low, where’s the utility in calculating a NAEP equivalent for the states’ standards? The paper itself observes that “There is, at best, a weak relationship between the NAEP score equivalents and the states’ average scores on NAEP.”
One has to wonder why a statistic from this study found its way into the President’s speech. But despite the differences in state standards and the umbrage expressed by the President about these differences, there is no evidence presented that the simple act of raising standards or making them uniform across states will, in fact, cause increased student learning.
Other statistics used to argue for higher standards also lack persuasiveness when they are closely examined. Regarding international comparisons, the 1995 Trends in International Mathematics and Science Study (then called the Third International Mathematics and Science Study) indicates that a particular cluster of states were outscored by only six nations in mathematics and by only one in science. The cluster was included Iowa, Maine, Minnesota, Montana, Nebraska, North Dakota, and Wisconsin (confirming Daniel Patrick Moynihan’s earlier observation that high test scores in the U. S. depended on proximity to Canada).
Despite their strong performance on this international measure, in its 2006 review of the “State of State Standards,” (59) the Thomas B. Fordham Foundation awarded these states’ standards letter grades that ranged from D+ to F, except for Iowa — which had no standards. Deliberately assigning low grades is a way of influencing the policy decision to increase the level of the standards and their uniformity.
Yet, again, no evidence is provided that simply raising standards improves learning. Distinctions between content standards, performance standards, and opportunity to learn standards have also been blurred. For example, although the 2000 National Council of Teachers of Mathematics includes “process” standards such as “recognize reasoning and proof as fundamental aspects of mathematics,” (60) currently there has been little or no talk in the calls of moving standards beyond simple content. While the President did appear to be calling for uniform performance standards, without adequate attention to opportunity to learn standards, such uniformity would be iniquitous.
Despite repeated failures in the past and the lack of any relationship to date between standards and performance, the Council of Chief State School Officers, the National Governors Association, Achieve, Inc., ACT and The College Board all have undertaken to create a set of “voluntary” common core state standards in reading and math with other subjects to follow. Work on the K-12 segment of the standards program is expected to be complete in December 2009.
How Promising Is This Reform?
The President also said, “Of course, raising standards alone will not make much of a difference unless we provide teachers and principals with the information they need to make sure students are prepared to meet those standards.” This information is, of course, student test scores. Finally, he said, we need to link these test scores to teacher performance to give more money to the “good” ones and dump the bad ones.
In other words, what we’re doing in schools is fine, we just have to do it better. (The more suspicious among us also think that “doing it better” means turning it over to the corporate sector). The old factory model is OK; we just need to replace some of the old manufacturing machinery with more information technology.
It is Taylorism for the information age.
David Marshak, Professor Emeritus at Seattle University, noticed (61) that the “improvements” the President and Secretary Duncan are calling for won’t make schools look much like Sidwell Friends School, the school that Obama’s daughters attend. And he asked, why doesn’t Obama try to make all schools more like Sidwell Friends? Certainly Sidwell has high standards of a sort, mostly for admission, but a read of the Sidwell philosophy gives a strong impression that the standards are not the essence of the school. Marshak draws on Peter Senge to direct us away from Taylorism. He cites Senge as saying “Today’s problems come from yesterday’s ‘solutions.’” Marshak comments:
Factory model schools, though always flawed by racism and classism, worked reasonably well when America was primarily an industrial society. But given our evolution into a more postindustrial cultures, the industrial elements of schools — mass production, rigid time and curricular structures, simplistic age-grading, and depersonalization and alienation — have become the problem, not the solution. (62).
In my opinion, the Obama/Duncan approach would only exacerbate the problems created by our industrial model — national academic standards and a national test, merit pay for higher test scores, a longer school day, a longer school week, a longer school year and charter schools handed off to entrepreneurs. More math, more science.
This is an industrial command-and-control model on steroids. Sidwell, by contrast, encourages a rich interdisciplinary curriculum designed to stimulate inquiry; the expression of artistic abilities; reflection; “stewardship of the natural world”; service to others; scientific investigation; creative expression; group as well as individual learning; personalization of learning and education of the whole person. It is worth noting that while President Obama provides us with articulate and detailed explanations of his plans for the economy, health-care, and foreign policy, he and Duncan both speak in glib generalizations and trivialities when they address education.
Higher standards as a curative for school ills have been actively promoted for over 100 years. It seems to have had no effect, at least from the perspective of the public school critics. Secretary Duncan spoke of the “education crisis” in virtually all of his early speeches, coupling it to the economic crisis. Thus, after 100 years of cries for higher standards, we are still in an education crisis. The push for higher standards has not worked. Perhaps it is time to try something else. The Sidwell approach looks good to me. Can it work in schools such as the one Linda Perlstein describes in Tested? (63). She thinks so, but not while high-stakes testing displaces true education. This is the critical issue. As Yong Zhao pointed out in the Detroit Free Press, (64) “President Barack Obama and national education officials appear to be moving the United States toward national K-12 standards — a mandate that would cause irreversible damage to an education system already suffering from No Child Left Behind.”
He concludes, “Obama and the nation's governors should preserve the legacy of our Founding Fathers and build a nation of diverse talents and creative entrepreneurs rather than a nation of standardized test-takers.”
Of standards, Wirtz and Lapointe also wrote, “A standard can be made ‘higher’ either by improving the educational objectives on which it is based or by raising scores or grades that are required for ‘passing’ and for being considered superior or excellent.”65 For the last 30 years or so, we have been trying the latter with disastrous results. The NGA/CCSSO/Achieve/ACT/College Board group is presumably doing the former. Given the cloak of secrecy that surrounds their work, though, and the questionable resumes of some of those who are part of the “work groups” producing the standards, I am dubious.
Notes & References
1. Ramirez, E., & Clark, K. (2009). What Arne Duncan Thinks of No Child Left Behind, US News & World Report. Retrieved February 15, 2009, from http://www.usnews.com /articles/education/ 2009/02/05/what-arne duncan-
thinks-of-no- child-left-behind.html
2. Brooks, D, (2009, May 7). The Harlem Miracle. The New York Times, A31.
3. Glod, M. (2007, December 4). U.S. Teens Trail Peers Around World on Math-Science Test. The Washington Post. retrieved December 5, 2007, from http://www.washington post.com/w pdyn/ content /article / 2007/12/04/AR2007 120400730.html
4. Data from the 2001 administration are used here because in the more recent PIRLS, the U. S. Department of Education shifted to a coarser mode of presenting poverty levels, reporting the scores of schools where all students received free and reduced-price meals, where some (undefined) did, and where none did.
5. Excessive Stress Disrupts the Architecture of the Developing Brain, Working Paper No. 3. (2006). Cambridge, MA: National Scientific Council on the Developing Child. Retrieved August 8, 2009, from http://developing child.harvard. edu/library/ reports_and_working_ papers/wp3/
PING BRAIN
6. Shonkoff, J., & Phillips, D.A. (Eds.) (2000). From Neurons to Neighborhoods: The Science of Early Childhood Development . Washington, D. C.: National Academy Press.
7. Berliner, D. C. (2009). Poverty and Potential: Out-of-School Factors and School Success. Boulder and Tempe: Education and the Public Interest Center & Education Policy Research Unit. Retrieved September 14, 2009, from http://epic policy.org/publication /poverty-and-potential
8. Berliner, D. C. (2009). Poverty and Potential: Out-of-School Factors and School Success. Boulder and Tempe: Education and the Public Interest Center & Education Policy Research Unit. Retrieved September 14, 2009, from http://epic policy.org/ publication/poverty-and-potential
9. Otto, M. (2007). Boy's Death Fuels Drives to Fund Dental Aid to Poor. Washington Post. Retrieved March 3, 2007, at http://www.washington post.com/wp-dyn/content/ article/2007/03/02/AR20070 30200827.html
10. U.S. General Accounting Office (2000). Oral Health: Dental Disease Is a Chronic Problem Among Low- Income Populations, GAO/HEHS-00-72 (Washington, DC: GAO), 8, figure 1. http://www.gao.gov/ archive/2000/ he00072.pdf
11. Perlstein, L. (2007). Tested: One American School Struggles to Make the Grade. New York: Henry Holt, 64.
12. Martin, M. (20002). A Strange Ignorance: The Role of Lead Poisoning in Failing Schools. Phoenix: Arizona School Boards Association Retrieved September 13, 2009 from http://www. azsba.org/static/ index.cfm?action= group&contentID=148
13. Berliner, D. C. (2009). Poverty and Potential: Out-of-School Factors and School Success. Boulder and Tempe: Education and the Public Interest Center & Education Policy Research Unit. Retrieved September 14, 2009, from http:// epicpolicy.org/publication/ poverty-and-potential
14. Alexander, K.L., Entwisle, D.R., & Olson, L,S. (2007, April). Lasting Consequences of the Summer Learning Gap. American Sociological Review, Vol.72, 167-180.
15. Fatsis, Stefan. (2001). Word Freak: Heartbreak, Triumph, Genius, and Obsession in the World of Competitive Scrabble Players. Boston: Houghton Mifflin Harcourt
16. Bracey, G.W. (2009). Education Hell: Rhetoric vs. Reality: Transforming the Fire Consuming America’s Schools. Alexandria: Educational Research Service, 143-156.
17. Brooks, D, (2009, May 7). The Harlem Miracle. The New York Times, A31.
18. Dobbie, W. & Fryer, R. G., Jr. (2009), Are High-Quality Schools Enough to Close the Achievement Gap? Evidence from a Bold Social Experiment in Harlem . Cambridge, MA: Harvard University . Retrieved June 5, 2009, from http://www.economics. harvard.edu /faculty/fryer/ files/hcz%204.15.2009.pdf http://epic policy.org/ publication/Bracey-Report 19. Pallas, A. (2009). Just How Gullible is David Brooks? New York: Gotham Schools. Retrieved May 8, 2009, from http://gotham schools.org/2009/05/08/just- how-gullible-is- david-brooks/
20. Dobbie, W. & Fryer, R. G., Jr. Are High-Quality Schools Enough to Close the Achievement Gap? Evidence from a Bold Social Experiment in Harlem . Cambridge, MA: Harvard University. Retrieved June 5, 2009, from http://www. economics. harvard. edu/faculty /fryer/files /hcz%204. 15.2009.pdf
21. Marshak, D. (2009). Obama’s School Choice: Shouldn’t the education that Malia and Sasha receive be available to all? Education Week. Retrieved August 9, 2009, from http://www.ed week. org/ew/articles /2009/08/03/37 marshak. h28.html (subscription required)
22. Cramer, P. (2009). Eli Broad describes close ties to Klein, Weingarten, Duncan. Gotham Schools. Retrieved April 4, 2009, from http://gotham schools.org/ 2009/03/11/eli-broad-describes- close-ties-to- klein-weingartenduncan
23. Duncan, A. (2009). Excerpts from Secretary Arne Duncan’s Remarks at the National Press Club. Washington, D.C.: U.S. Department of Education. Retrieved May, 30, 2009, from http://www. edgovblogs. org/Duncan /2009/06/excepts- from-secretary- arne-duncan %E2% 80%99s- remarksat-the- national- press-club
24. Brown, J., Gutstein, E., & Lipman, P. (2009, Spring). Arne Duncan and the Chicago Success Story: Myth or Reality? Rethinking Schools. Retrieved August 19, 2009, from http://www. Rethinking s chools.org/ archive/23_03/ arne233.shtml
25. Lynch, D. (2009, October 2). Safety at Fenger Yields to Reform. Chicago Sun-Times. Retrieved October 3, 2009,from http://www. suntimes. com/news/otherviews/ 1802256, CST-EDT-open02.article (Link no longer activeas of November 1, 2009.). /Also available at Substance (October 10, 2009) at “Turnaround: The deadliest Reform of All” http://www. substancenews. net/articles. php? page= 918& section=Article. The article was also published as the Page One story in the October 2009 print edition of Substance. 26. Civic Committee. (2009), Still Left Behind: Student Learning in Chicago’s Public Schools. Chicago: The Commercial Club of Chicago. Retrieved June 20, 2009, from http://www. Civic committee. org/Still% 20Left% 20Behind%20v2.pdf
27. Rado, D. (2006, July 12). City schools hail test scores news. Chicago Tribune. 1. Retrieved November 5, 2009, from http://tinyurl.com/bracey-chitrib-1 (Purchase required).
28. Editorial. (2006, July 14). An ‘A’ for Everybody. Chicago Tribune, 26. Retrieved November 5, 2009, from http:// tinyurl. com/ bracey-chitrib-2a (Purchase required).
29. National Center for Education Statistics. (2003) The Nation’s Report Card: Trial Urban District Assessment. Retrieved August 10, 2009, from http://web.archive. org/web/ 20040 722021456 /nces.ed. gov/nations reportcard/pdf/dst2003 /2004454XC8.pdf
30. Frankenberg, E., Lee, C., Orfield, G. (2003) A Multiracial Society with Segregated Schools: Are We Losing the Dream? Harvard Civil Rights Project. Retrieved September 3, 2009, from http://www. civil rights project.ucla.edu /research/ reseg03/ resegregation03.php
31. Benjamin, E. (2009, Febrary 6). Bloomberg Warns: 'Riots In The Streets' If No Mayoral Control . New York Daily News. Retrieved February 6, 2009, from http://www.ny dailynews.com/blogs /dailypolitics/ 2009/02/bloomberg- warns-riots -in-the-s.html
32. Hernandez, J. (2009, June 1). New York City Shows Gains in Math. New York Times. A1. Retrieved June 6, 2009, from http://www. nytimes.com /2009 /06/02/ ny region /02math. html
33. Kolodner, M. & Monahan, R. (2009, June 7). State math exam scores have risen — but it's because tests have gotten easier. New York Daily News. Retrieved June 8, 2009, from http://www.ny dailynews. com/ny_local /education/ 2009/06/ 07/ 2009-06- 07_can_ you_do_these_math_ tests_ with_ easier_ exams_this_year_ news_puts_you _to_challen .html
34. Hernandez, J. (2009, September 13). Botched Most Answers on New York State Math Test? You Still Pass. New York Times, A14. Retrieved September 14, 2009, from http:// www.ny times.com/ 2009/09/14/ education/14scores. html http://epic policy.org/ publication/
35. Pallas, A. & Jennings, J. (2009). “Progress” Reports. In Haimson, L. & Kjellberg, A. (Eds),. NYC Schools Under Bloomberg and Klein: What Parents, Teachers, and Policymakers Need to Know, 37. New York: Lulu.
36. Haimson, L. & Kjellberg, A. (Eds), (2009). NYC Schools Under Bloomberg and Klein: What Parents, Teachers, and Policymakers Need to Know. New York: Lulu. Retrieved November 4, 2009, from http://www. lulu.com/ product/ download/nyc-schools-under-bloomberg klein-what- parents-teachers-andpolicy makers- need-to-know/4970769
37. Thompson, W. C., Jr. (2008). Thompson: Education Department Continues “Shell Game” by Inflating Restructuring Savings. New York, NY: Office of the City Comptroller. Retrieved September 17, 2009, from http://www. comptroller.nyc. gov/press/2008_ releases/pr08 -11-159.shtm
38. Hernandez, J. (2009, April 22). Schools Panel Is No Threat to the Mayor’s Grip. New York Times. A1. Retrieved April 23, 2009, from http://www. nytimes. com/2009/ 04/23/ny region/23 panel.html
39. Sullivan, P.J. (2009). Inside the Panel for Educational Policy. In Haimson, L. & Kjellberg, A. (Eds), NYC Schools Under Bloomberg and Klein: What Parents, Teachers, and Policymakers Need to Know . New York: Lulu. http: // www. lulu. com/ product/ download /nyc-schools-under-bloombergklein- what- parents- teachers-and policy makers- need- to- know/4970769
40. Herbert, B. (2004, March 19) Bob Herbert. Teaching Us a Lesson. New York Times. Retrieved March 20, 2004, from http:// www.nytimes. com/2004/03/19/ opinion/ 19HERB.html
41. Lewin, T. & Medina, J. (2003, July 31) To Cut Failure Rate, Schools Shed Students. New York Times. Retrieved
April 30, 2009, from http://www. nytimes. com/2003/ 07/31/ny region/31 PUSH.html
42. Orel, S. (2002) World of Opportunity Background. Substance. Retrieved September 8, 2009, from http:// www. substancenews. com/archive/April02/ opportunity.htm
43. Sullivan, P.J. (2009). Inside the Panel for Educational Policy. In Haimson, L. & Kjellberg, A. (Eds), NYC Schools Under Bloomberg and Klein: What Parents, Teachers, and Policymakers Need to Know . New York: Lulu. http://www. lulu.com/ product /download/ nyc-schools -under-bloomberg klein- what-parents- teachers-and policy makers- need-to-know/4970769
44. Moore, M. (2007, March 22). More Mayors Move to Take Over Schools. USA Today. Retrieved March 22, 2007, from http://www.usatoday. com/news/ education/2007- 03-20-cover-mayors- schools_N.htm
45. Ravitch, D. (2009). Obama Gives Bush a 3rd Term in Education. Huffington Post. Retrieved August 10, 2009, from http://www. huffingtonpost. com/diane-ravitch /obama-gives-bush-a- 3rd-te_b_215277.html
46. Barber, B. (1998). A Passion for Democracy. Princeton: Princeton University Press, 225.
47. Cremin, L. (1964). Transformation of the School: Progressivism in American Education 1876-1957. New York: Vintage, 5.
48. Editors. (1958). Crisis in Education. Life Magazine, 25.
49. Interview with Arthur Bestor. (1958). What went wrong with U.S. schools, U.S. News and World Report, January 24, 1958, pp. 68-77.
50. College Entrance Examination Board (1977). On Further Examination: Report of the Advisory Panel on the Scholastic
Aptitude Test Score Decline and Appendices. Princeton: author, 28.
51. Wirtz, W. & Lapointe, A. (1982). Measuring the Quality of Education: A Report on Assessing Educational Progress. Washington, D. C.: Wirtz & Lapointe, 2-3.
52. Gardner, D. P. (Chair). A Nation at Risk: An Imperative for Educational Reform. Washington, D. C.: U. S. Government Printing Office. Retrieved August 19, 2009, from http://www. ed.gov/pubs/ NatAtRisk/index.html
53. S. Res. 66, Congressional Record, January 20, 1995, p. S1282. Retrieved September 17, 2009, from http://thomas. loc.gov/cgi-bin/query /z?c104:S. RES.66.ATS:
54. Editorial. (1995, February 13). Maligning the History Standards. The New York Times. A18. Retrieved September
10, 2009, from http://www. nytimes.com/ 1995/02/13/ opinion/maligning-the- history-standards.html http:// epicpolicy.org/ publication/Bracey-Report
55. Spillane, R. R. (1993, June 2). Student-Achievement Standards. Education Week. Retrieved September 8, 2009, from http://www.edweek. org/ew/articles/1993/ 06/02/ 36spil. h12. html?qs=Robert+Spillane (subscription required)
56. Cremin, L A. (1989) Popular Education and Its Discontents. New York: Harper & Row, 7.
57. National Center for Education Statistics (2007). Mapping 2005 State Proficiency Standards Onto the NAEP Scales, Executive Summary. Washington, D. C. U. S. Department of Education Institute of Education Science, Retrieved September 15, 2009, from http://nces.ed. gov/nations reportcard/pubs/studies /2007482.asp
58. Scoring “Basic” on NAEP is often taken as equivalent to “failing.” Elsewhere, though, I have reported that 50% of students who scored Basic in math as seniors went on to institutions of higher education and about half of those attained a bachelor’s degree or better.
59. Finn, C.E., Jr., Petrilli, M.J., & Julian, L. (2006). The State of State Standards 2006. Washington, D.C.: Thomas B. Fordham Institute. Retrieved September 15, 2009, from http:// www. edexcellence. net/ detail/news. cfm?news_id=358.
60. National Council of Teachers of Mathematics (2000) Principles and Standards for School Mathematics, Appendix: Table of Standards and Expectations. Reston, VA: National Council of Teachers of Mathematics. Retrieved September 15, 2009, from http:// standards.nctm. org/ document/ appendix/process.htm
61. Marshak, D. (2009, August 2) Obama’s School Choice. Retrieved August 3, 2009, from http://www. edweek. org/ew/ articles/ 2009/08/03/37 marshak. h28.html (subscription required)
62. Marshak, D. (2009, August 2) Obama’s School Choice. Retrieved August 3, 2009, from http://www. edweek.org/ew/ articles /2009/ 08/03/37 marshak.h28.html (subscription required)
63. Perlstein, L. (2007). Tested: One American School Struggles to Make the Grade. New York: Henry Holt.
64. Zhao, Y. (2009, August 30). National education standards can end up hurting students. Detroit Free Press. Retrieved August 31 2009, from http://www .freep. com/article /20090830/ OPINION01/ 908300438/ 1069/OPINION01 /National-educationstandards- can-end- up-hurting-students (Link no longer active as of November 1, 2009.)
65. Wirtz, W. & Lapointe, A. (1982). Measuring the Quality of Education: A Report on Assessing Educational Progress. Washington, D. C.: Wirtz & Lapointe, 4-5.